A tale of getting https://grafana.net/dashboards/878 to work...
Firs, I need to install python:
apt-get install python
The Change a bit in the Script from https://github.com/trevorndodds/elasticsearch-metrics/blob/master/Grafana/elasticsearch2elastic.py, so the header was:
#!/usr/bin/python
import datetime
import time
import urllib
import json
import urllib2
import os
import sys
And finally this script is running - notice this in not by cron, its constantly running:
root@elkserver1:/data# python elasticsearch2elastic.py
Total Elapsed Time: 6.79649996758
Total Elapsed Time: 1.30685281754
Total Elapsed Time: 1.56892991066
Total Elapsed Time: 2.67802596092
Total Elapsed Time: 2.37758088112
Total Elapsed Time: 2.56103205681
After this, the dashboard was pretty full of read exclamations signs, and the article at https://grafana.net/dashboards/878 states:
- Tested this with Elasticsearch 2.4.X & 5.1.X
- On 5.X you will have to change the template to use cluster_name.keyword unless you set cluster_name to not_analyzed
Well, I decided to Change the Clustername variable (found under the cog - Templating:

Here, "cluster_name" is changed to "cluster_name.keyword"
Do the same for "name" to "name.keyword"
This improved the Dashboard a lot:

But in several places, the red exclamation sign is still telling us that there is a problem, like:
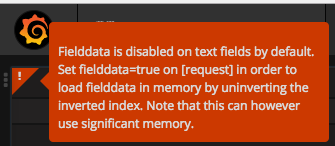
So we need to change the field - documented in https://www.elastic.co/guide/en/elasticsearch/reference/5.0/fielddata.html
I ran this in Kibana's Dev Console for the status field (not the request as the screenshot shows):
PUT elasticsearch_metrics-*/_mapping/message
{
  "properties": {
    "status": {
      "type":     "text",
      "fielddata": true
    }
  }
}
And got
{
  "acknowledged": true
}
same for:


doing
PUT elasticsearch_metrics-*/_mapping/message?update_all_types
{
  "properties": {
    "name": {
      "type":     "text",
      "fielddata": true
      }
  }
}
giving us a lot of fixed rows:

Fixing the CPU, CPU Instance, Memory etc (if they are empty). The problem here (also) seems to be that "name" is not field-data enabled. The best way is to make if field-data enabled. In Kinana Dev Console:
PUT elasticsearch_metrics-*/_mapping/message?update_all_types
{
  "properties": {
    "name": {
      "type":     "text",
      "fielddata": true
    }
  }
}
Alternatively, Change all panels; change Group by clause from "name" to "name.keyword" :

Well - I first used the first part - changing the field to fielddata: true, and the next morning this was a fact:

Should have looked as this (with name replaced with name.keyword):

No clue why the change kind of stopped at 01:00.
Read about the Elasticsearch 5.0 changes to strings her: https://www.elastic.co/blog/strings-are-dead-long-live-strings