Sidehistorik
...
And sourcetype and index:

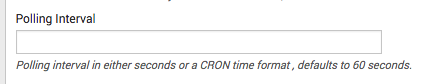
Notice the polling interval:
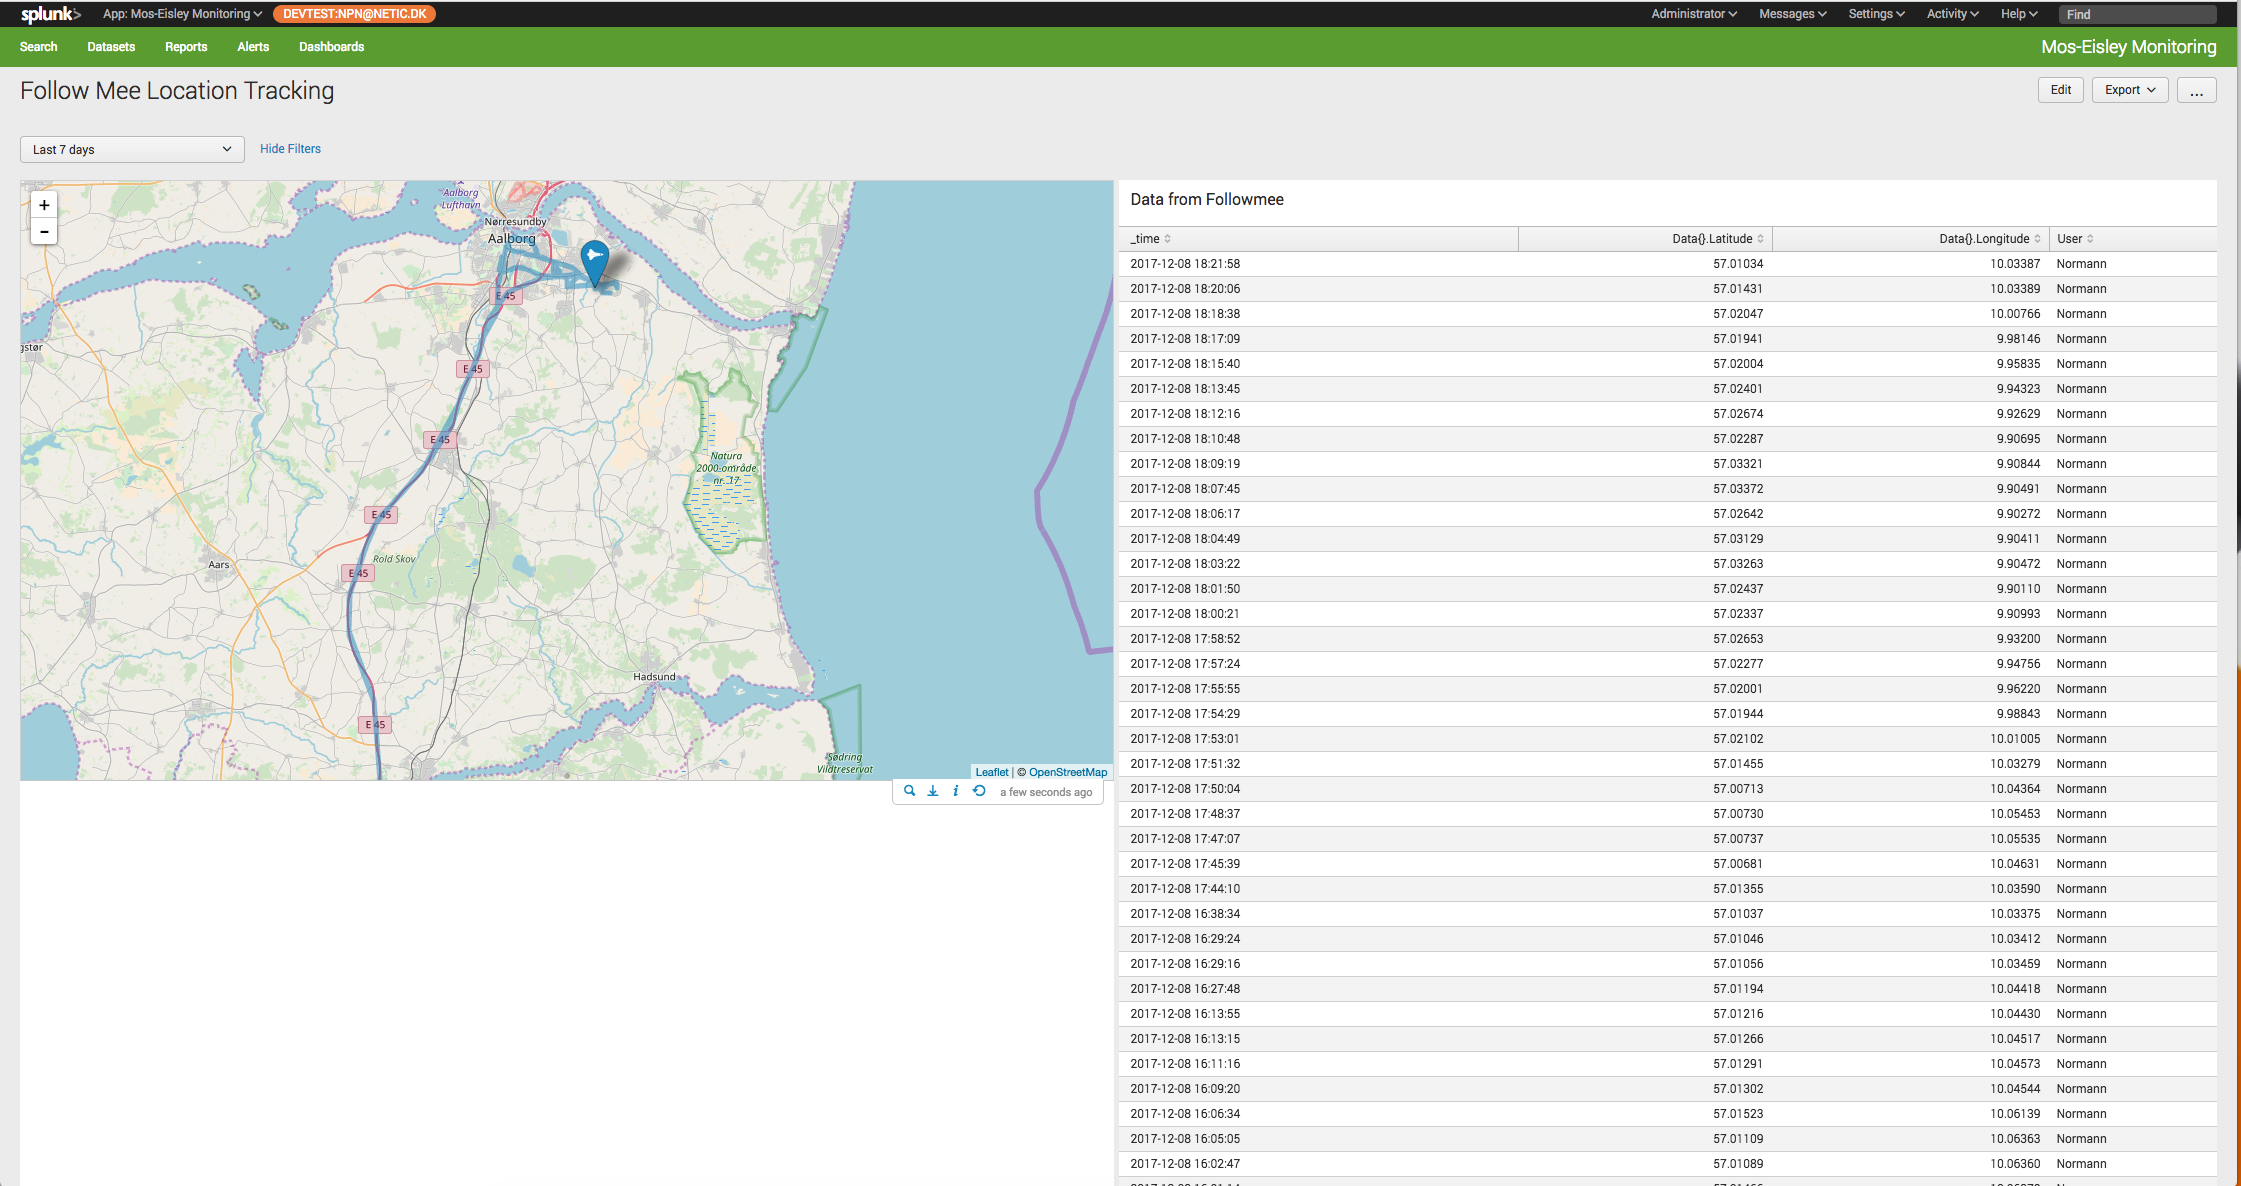
Presenting the data in splunk
Looking at possible visualisations, I first went for the map/geostats visualisation, but the density and zoomlevel is more world like than needed, so I installed the Location Tracker - Custom Visualization.
And created the needed search
| Kodeblok |
|---|
index="followmee" | dedup _time | eval User="Normann" | table _time "Data{}.Latitude" "Data{}.Longitude" User |
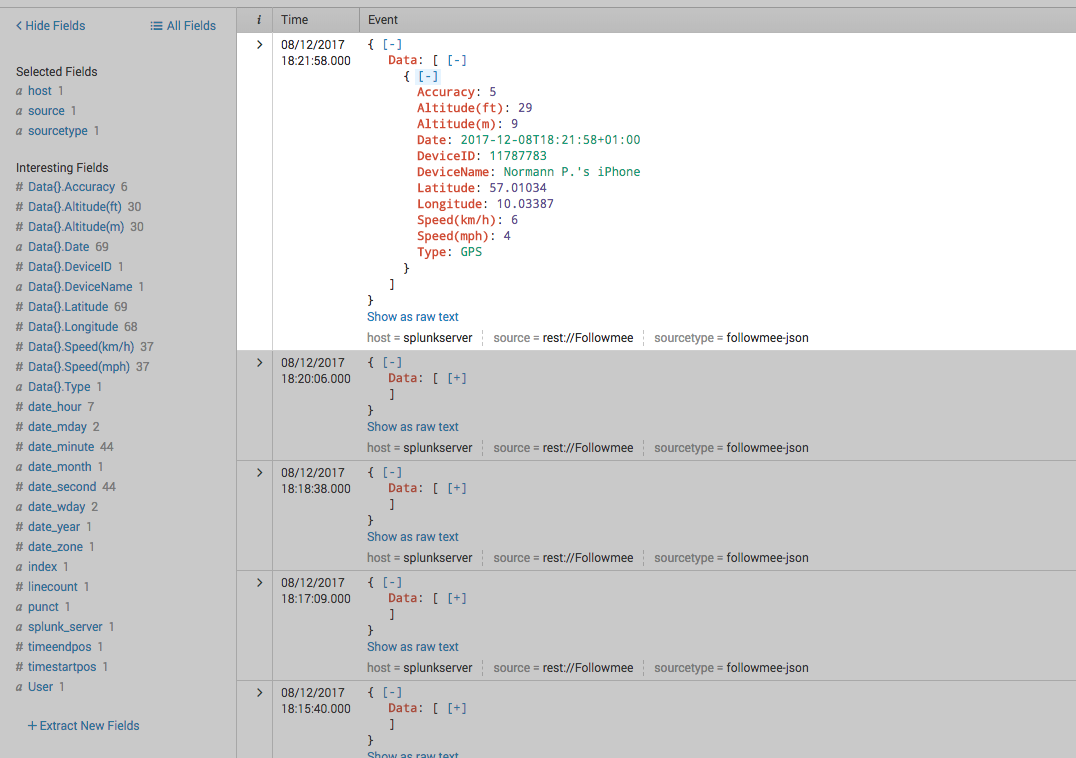
after looking at what the REST Add On fetches from the followmee.com API:
And then build a Dashboard: