If we want to measure and log "real" pageviews from out Confluence, see Access Logging in Confluence, and we a not doing this from within Confluence, we need to filter out false results.
This is my findings regarding to filtering results:
Robots and Crawlers
We need to filter out those:
type: apache AND (request.keyword: \/display* OR request.keyword: \/pages\/viewpage.action*) AND NOT ( agent: *facebook* OR agent: *crawler* OR agent: *bot* OR agent: *Bot* OR agent: *Spider*)
index=apache AND host=moserver AND (uri="*/display/*" OR uri="*/viewpage.action/*") useragent!="*bot*" useragent!="*spider*"useragent!="*facebookexternalhit*" useragent!="*crawler*"
HTTP Codes
Often, if You page is down or under maintenanace, apache/ngix logs will return HTTP Code 502 or HTTP Code 503 - See https://www.w3.org/Protocols/rfc2616/rfc2616-sec10.html
These can be removed from the search results; - or HTTP Code 200 can be added to give only possitive results:
type: apache AND (request.keyword: \/display* OR request.keyword: \/pages\/viewpage.action*) AND response: 200 AND NOT ( agent: *facebook* OR agent: *crawler* OR agent: *bot* OR agent: *Bot* OR agent: *Spider*)
index=apache AND host=moserver AND (uri="*/display/*" OR uri="*/viewpage.action/*") useragent!="*bot*" useragent!="*spider*"useragent!="*facebookexternalhit*" useragent!="*crawler*" AND status=200
Reffers
A User request for a Confluence page spawns several request from the Confluence to the Confluence itself, and from the client to the Confluence server, but only one represents the actual page request. In the above, this is covered by:
request.keyword: \/display* OR request.keyword: \/pages\/viewpage.action*
uri="*/display/*" OR uri="*/viewpage.action/*"
Monitoring
Monitoring a website from various Souces (Zenoss, Nagios, Datadog etc etc) also represents a large (often the largest) number of hits, and we need to remove these, this can be done is several ways:
- Identifying all agent types of the monitoring
- Often monitoring is on / - giving the agent a HTTP Code 302 back code. This is not the case for mysite, where apache makes a rewrite; hence the monitoring gets a HTTP Code 200 OK
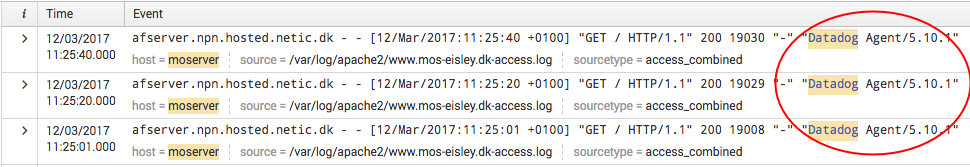
Looking into You logs will often make it pretty easy to Identify monitoring:
Here its my datadog monitoring from another server:
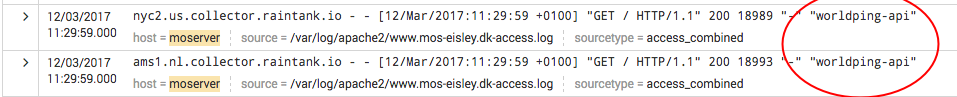
And from Worldping via Grafana: